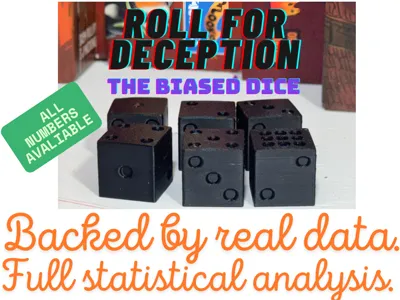
Roll for Deception - The Biased Dices


Print Profile(1)

Description
Is My d6 Die Fair? A Statistical Analysis After 2000 Rolls
Have you ever wondered if a small tweak in design could affect something as “random” as a dice roll? As a maker and board game enthusiast, I decided to find out.
🛠️ The Maker Twist: A Custom Weighted Die
I designed and 3D-printed my own 6-sided die (d6), but with a small internal modification — I added extra weight directly beneath face “1.”
Why?
⚖️ The Physics Behind It
In a fair die, the mass is evenly distributed, and each face should have an equal chance (1 in 6) of landing face-up. But if one side is heavier, it naturally wants to settle on the bottom when thrown.
So if face 1 is heavier, then its opposite — face 6 — should come up more often.
This is a basic principle of center of gravity. When the mass is unbalanced, the heavier face resists rotation and settles downward more frequently.
🎯 The Hypothesis
If I increase the weight on face 1, face 6 will appear more often than the others.
To put this theory to the test, I rolled the die 2,000 times and recorded every single result.
📊 Results: Observed vs. Expected Frequencies
In a perfectly fair die, each face should appear about 333.33 times out of 2,000 rolls.
Here’s how my die performed:
| Face | Observed | Expected | Deviation | % Deviation |
|---|---|---|---|---|
| 1 | 180.00 | 333.33 | -153.33 | -46.00% |
| 2 | 356.00 | 333.33 | +22.67 | +6.80% |
| 3 | 300.00 | 333.33 | -33.33 | -10.00% |
| 4 | 276.00 | 333.33 | -57.33 | -17.20% |
| 5 | 344.00 | 333.33 | +10.67 | +3.20% |
| 6 | 544.00 | 333.33 | +210.67 | +63.20% |
🔍 Interpretation:
- Face 6 appeared 544 times — 63% more than expected!
- Face 1, the weighted side, appeared just 180 times, which is 46% less than expected.
That’s a clear, dramatic pattern. But is it statistically valid?

🧪 Chi-Squared Test: Is the Die Fair?
To test fairness mathematically, I ran a Chi-Squared Goodness-of-Fit Test. This compares the observed results to the expected results, and tells us if any differences are likely due to chance or to actual bias.
Test Results:
- Chi-squared statistic: 188.61
- p-value: 7.75 × 10⁻³⁹
In statistics, a p-value < 0.05 means the results are significant.
Mine? Basically zero.
📈 Stats Summary
- 🎯 Most frequent face: 6
- 📉 Least frequent face: 1
- 🧮 Standard deviation of counts: high (strong spread from expected)
- 📊 Deviation pattern: consistent with intentional weight shift
Even with 2,000 rolls — a robust sample — the trend holds strong.
🧠 Why This Matters
This experiment shows just how sensitive dice are to weight and balance. A tiny bit of extra infill on one face can cause large deviations over time.
It’s a fun project, but it also highlights something serious:
If your game relies on randomness, unfair dice can ruin the experience — or rig it completely.
License
You shall not share, sub-license, sell, rent, host, transfer, or distribute in any way the digital or 3D printed versions of this object, nor any other derivative work of this object in its digital or physical format (including - but not limited to - remixes of this object, and hosting on other digital platforms). The objects may not be used without permission in any way whatsoever in which you charge money, or collect fees.
Comment & Rating (4)