Acceleration Lab


Print Profile(1)

Description
This activity is based on the Paradigm Lab for the Accelerated Motion unit in the Modeling Physics curriculum. The basic idea is to have the students derive the basic equations for motion that in a traditional physics class the students would simply be provided with. Research shows that when students build knowledge for themselves they are much more likely to retain that knowledge and will be able to build on that knowledge.
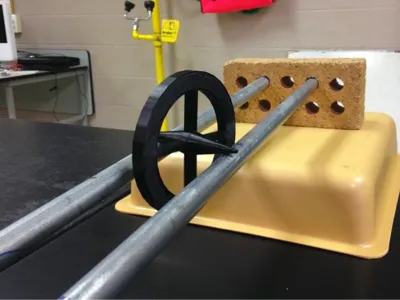
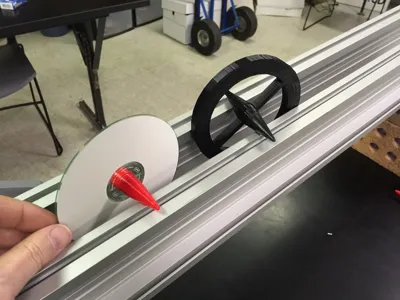
The apparatus is placed between two parallel tracks at a slight angle. These tracks can be electrical conduit or something like Pasco Dynamics tracks (if you have them) on their sides. The cones sit on the tracks and allow acceleration to be slow enough to allow students to easily mark its position at one second intervals.
There are two versions of the apparatus. One that is complete and a second that requires a CD or DVD as the central disk.
Objectives
- Students will create graphical models of accelerated motion
- Students will create a mathematical model for accelerated motion
Standards
- NGSS Scientific and Engineering Practices
- Developing and using model
- Analyzing and interpreting data
- Using mathematical and computational thinking
- NGSS Crosscutting Concepts
- Patterns - Analyzing data to determine rates of change. In this case, the constant rate of change in velocity and the varying rate of change in position.
- Scale, proportion, and quantity - A small acceleration can result in very large velocities given enough time.
- NGSS Core Idea PS2.A: Forces and Motion
Lesson Plan and Activity
- Show the Acceleration Apparatus and ask students to describe its motion and how it is different from the buggy cars (battery powered cars that move at a constant velocity, used in the last unit)
- Students collect data by marking the position of the disk every second as it rolls down the rails. Just use a dry erase marker on the conduit. A metronome or metronome app should be used to help the students. They should practice once before collecing their lab data.
- Students create a position vs. time graph and use the regression functions in their calculators to find an equation that explains the data. If they were careful in their data collection a quadratic equation should fit very nicely to the data.
- Transform the data to velocity vs. time and graph. Students can borrow the idea of a secant line from their math class to accomplish this. The graph should be linear. Find the equation of the line.
- Students whiteboard and share results with the class
- Through Socratic dialog, help students determine what the variables and the coefficients in both the equations derived from the position and velocity data. (See example student data below)
Materials Needed For each lab group:
- 2 Lengths of electrical conduit (I've also used dynamics tracks set on their side)
- Bricks to hold the conduit
- 3D Printed Acceleration Lab Apparatus
- Dry erase markers
- Whiteboard
- Metronome or metronome app, set to 60 beats/minute (May only need one for the class)
- Students should have already developed the Constant Motion Model
References
Example Position-Time Data:

Example Graph of Position-Time Data:

Velocity-Time Data calculated from Lab Data:

Velocity-Time Graph:

Whiteboard from Student Group of Data Analysis:

License
You shall not share, sub-license, sell, rent, host, transfer, or distribute in any way the digital or 3D printed versions of this object, nor any other derivative work of this object in its digital or physical format (including - but not limited to - remixes of this object, and hosting on other digital platforms). The objects may not be used without permission in any way whatsoever in which you charge money, or collect fees.
Comment & Rating (0)