Three-level stepped colored China topographic map (true survey data standard national border equirectangular projection)


Print Profile(2)

Description
With real survey data, the elevation difference is much more exaggerated than models on the market, but it is more realistic. For example, Mount Everest is 8848m, and the Qinghai-Tibet Plateau averages 4000m, a difference of more than two times. Printing this model really gives the feeling of a needle inserted into the plateau.
Model height data source: DEM1km data from the National DEM 1km, 500m, and 250m data (SRTM 90m) of the Resource and Environmental Science Data Center of the Chinese Academy of Sciences. Link https://www.resdc.cn/data.aspx?DATAID=123 The data comes from the radar topographic mapping SRTM (Shuttle Radar Topography Mission, SRTM) data of the US Space Shuttle Endeavour. Logarithmic and scale transformations were applied during mapping. Mapping information for the Turpan Depression was incorrect and manually corrected.
National and provincial border data source: china-geospatial-data-GB2312 Link https://github.com/gmt-china/china-geospatial-data/releases
Projection method: Equirectangular Projection, with parallel lines of latitude and longitude.
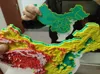
Parts have been separated, 3 color changes, friends without AMS can set pause for color change on the preview page.
The model does not include a base plate, the sample image shows the printing effect with tissue paper covered on the PEI build plate.
Comment & Rating (0)