Search models, users, collections, and posts

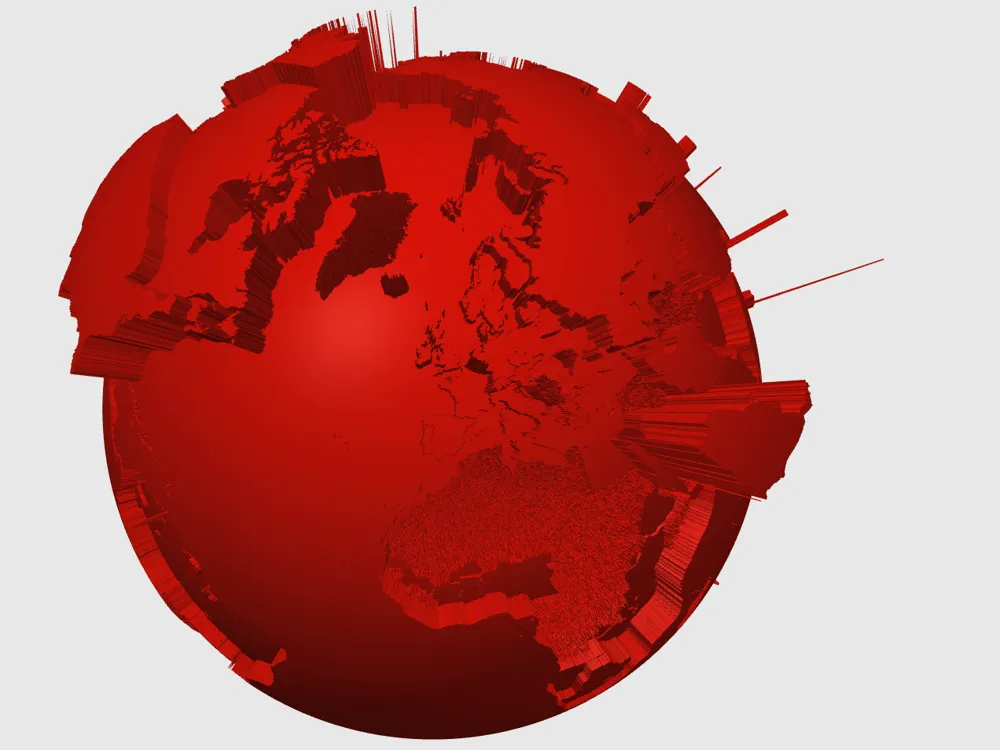
Globe of consumption based CO2 emissions/capita
IP Report
Print Profile(1)

0.2mm layer, 2 walls, 15% infill
Designer
3.5 h
1 plate
Open in Bambu Studio
Boost
4
10
0
0
15
3
Released
Description
🌍 CO₂ Globe — Consumption-Based Emissions per Capita (3D Physicalization)
This 3D globe visualises consumption-based CO₂ emissions per capita for every country in the world.
Instead of using flat maps or charts, the data is transformed into a physical shape where each country’s height above or below sea level represents its relative climate impact.
📌 How to read the globe
- Sea level = the global average consumption-based CO₂ emissions per capita.
This is the reference point for all countries. - Countries rising above the surface
→ Their per-capita footprint is higher than the world average. - Countries sinking below the surface
→ Their per-capita footprint is lower than the world average. - Bumpy or uneven regions
→ These are countries where no reliable CO₂ data was available.
For these areas, the model assigns the average value of the continent to avoid large holes in the surface.
🎯 Purpose of the model
The goal is to make global climate inequality tangible.
When printed, you can literally feel the difference between high-emission and low-emission countries. Wealthier nations tend to form tall ridges, while many low-income regions fall below the surface.
This type of physicalization makes climate data easier to understand in education, exhibitions, workshops and discussions about global responsibility and fairness.
🧩 Technical notes
- Built from gridded longitude–latitude data projected onto a sphere.
- Country shapes come from Natural Earth boundaries.
- CO₂ data comes from consumption-based emission statistics (e.g., Our World in Data / research datasets).
- Missing data is replaced with continental averages for smoothness.
- The mesh is generated programmatically; no manual sculpting.
🖨️ Printing recommendations
- Print in at least 8 cm diameter if you want the height variations to be clearly visible.
- Use 0.15–0.2 mm layer height for best surface detail.
- Supports are normally not required if printed in two hemispheres.
- Can be scaled freely — relative heights remain correct.
💬 Suggested uses
- Teaching about climate inequality
- Demonstrating the difference between production-based and consumption-based emissions
- Public exhibits or workshops
- Discussion starter on global fairness and sustainability
License

This user content is licensed under a
Creative Commons Attribution-Noncommercial


Comment & Rating (0)