EPaper Dashboard Waveshare 10.85''


Print Profile(1)
Description
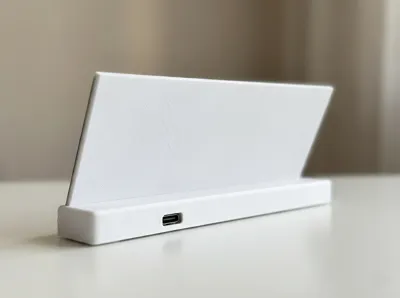
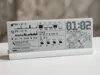
This is a project for my dashboard, which features a display Waveshare 10.85'', currently one of the largest available.
I set out to create a beautiful, minimalist case that would showcase the display’s best features.
The screen consists of two matrices combined into a single display, with one controller and a single interface (HAT) for connecting to a Raspberry Pi. From a user’s perspective, you work with this as a single display - the driver handles the rest.
In my implementation, I use a Raspberry Pi Zero 2W. The large display allows you to show a lot of useful information at once, while the Pi Zero 2W serves as an easily programmable heart of the dashboard.
One of the main advantages of this display, and the reason it’s ideal for a dashboard - even though it’s only black and white - is its support for partial refresh. This allows you to update specific elements on the screen without having to redraw the entire display. Please note that most color displays do not support partial updates and cannot be used as dashboards requiring frequent screen refreshes.
I have included my SolidWorks source files with the project, so you can easily adapt this design to suit your needs.
So you’ve 3D printed a beautiful enclosure for your e-ink display and wired up your Raspberry Pi, but you don't want to code an entire interface from scratch?
==UPDATE 07/04/2026:==
Added a new useful widget: Antigravity Usage Data. It displays your Antigravity usage, including limits, as well as the next limit reset time.

==UPDATE 11/03/2026:==
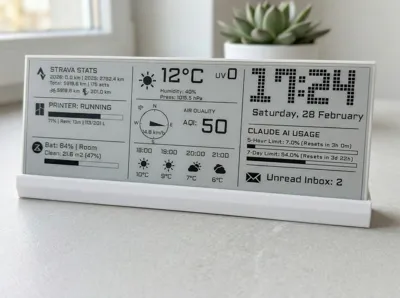
Added a new useful widget: Claude Code Usage Data. It displays your Claude Code usage, including daily and weekly limits, as well as the next limit reset time.

==UPDATE:==
New dashboard code! With lot's of useful widgets!
To let you start using your display immediately, I have prepared a fully automated, plug-and-play smart dashboard script. It is designed to work with minimal configuration .
Main Features & Widgets:
- (NEW!) Antigraviry usage data: Displays usage data for Antigravity, showing the limits, and limit reset time.
- Claude Code usage data: Displays usage data for Claude Code, showing the daily limit, weekly limit, and limit reset time.
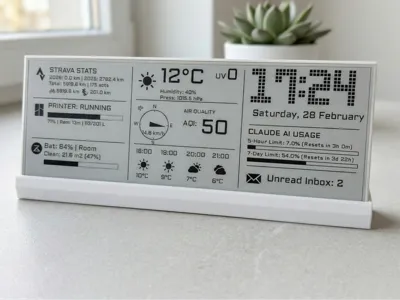
- Bambu Lab Live Monitoring: Track your active 3D prints at a glance! Displays current print status, completion percentage, remaining time, and current layer progress directly from your printer.

- Weather & Environment: Accurate 4-hour forecast, current temperature, humidity, UV index, and Air Quality (AQI) with visual alerts for high pollution levels.

- Strava Integration: Keep an eye on your fitness journey with your total distance, yearly workout count, and a specific breakdown for cycling and hiking.

- Roborock Vacuum: Live battery level, current status, and a dynamic progress bar that appears during active cleaning or washing sessions.

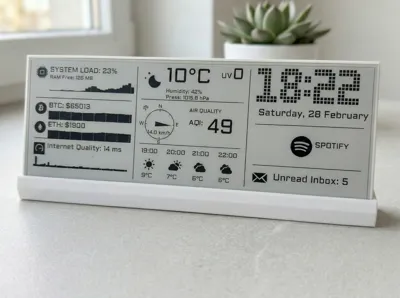
- Spotify: Shows the currently playing track, artist, and album cover.

- Gmail: A quick counter for your unread inbox emails.

Don't have the time to generate API tokens for all those services right now? No problem. The script is designed with smart fallbacks.
- System Monitor: Live Raspberry Pi load (CPU %, free RAM, and performance sparklines).
- Crypto Ticker: Live BTC and ETH prices alongside 7-day trend graphs.
- Network Health: Live ping monitor to check your internet connection quality.

- Time Progress - A minimalist time tracker that visualizes your day, year, and life as progress bars to elegantly remind you that every moment counts.

Get the full dashboard code and installation guide here.
Need to test your hardware first?
If you just assembled your project and want to verify that your screen are working correctly before configuring the main dashboard, I kept the old repository with a basic testing script. It is perfect for a quick hardware check.
Hardware components:
- Raspberry Pi Zero 2 W
- Waveshare 10.85inch e-Paper display with driver HAT
Assembly Guide:
Disclaimer: All work involving the display should be carried out with extreme care. The case is designed for the display to fit precisely but without force. If you encounter resistance or are unable to insert a component easily, do not use force as this may damage the display.
1. Disconnect the display from the HAT board if it is already connected.
2. Insert the display into its slot.
3. Insert the display support into the slot behind the display. Ensure that the display latch is at the top to provide additional pressure and secure the display in place.
4. Use hot glue to lightly secure the display latch from the inside at the areas with designated cutouts. You may also use small pieces of strong tape. The goal is to prevent the latch from accidentally falling out. Do not use cyanoacrylate-based glue (super glue) as it may damage the display.
5. Connect the HAT board to the Raspberry Pi, then attach the interface cable from the display.
6. Install the assembled board into the case.
Please find the full assembly video guide:

Thank you for your support and for boosting my model! it's extremely motivating and inspires me to keep working on developing this project.
Comment & Rating (82)